PYTHON ANALYTICS PORTFOLIO
Storm Data Analysis Pipeline
A reproducible analytics project demonstrating practical Python, SAS data ingestion, data transformation, statistical summarization, visualization, and automated reporting.
STORM SUMMARY RECORDS
3,172
Prepared records · limitations documented
DETAIL OBSERVATIONS
50,764
Detailed storm observations analyzed
2016 STORMS
90
Storm-level wind statistics produced
DAMAGE RECORDS
38
Cost-linked storms in damage analysis
Explore the project
Project Summary
This portfolio converts a traditional SAS-style storm analysis workflow into a transparent Python pipeline. A complete sequential code-cell rerun, independent artifact checks, and documented identity safeguards are documented in Validation & QC. It reads SAS and Excel data, prepares analysis-ready datasets, derives storm attributes, joins summary and detail sources, calculates storm-level statistics, and exports reusable Excel/CSV reports and figures.
PythonpandasNumPyMatplotlibopenpyxlSAS7BDATJupyter
Portfolio Evidence
Data sourcesSAS + Excel
WorkflowEnd-to-end
OutputsCSV + XLSX + PNG
Primary focusSAS-to-Python
Featured Visualization
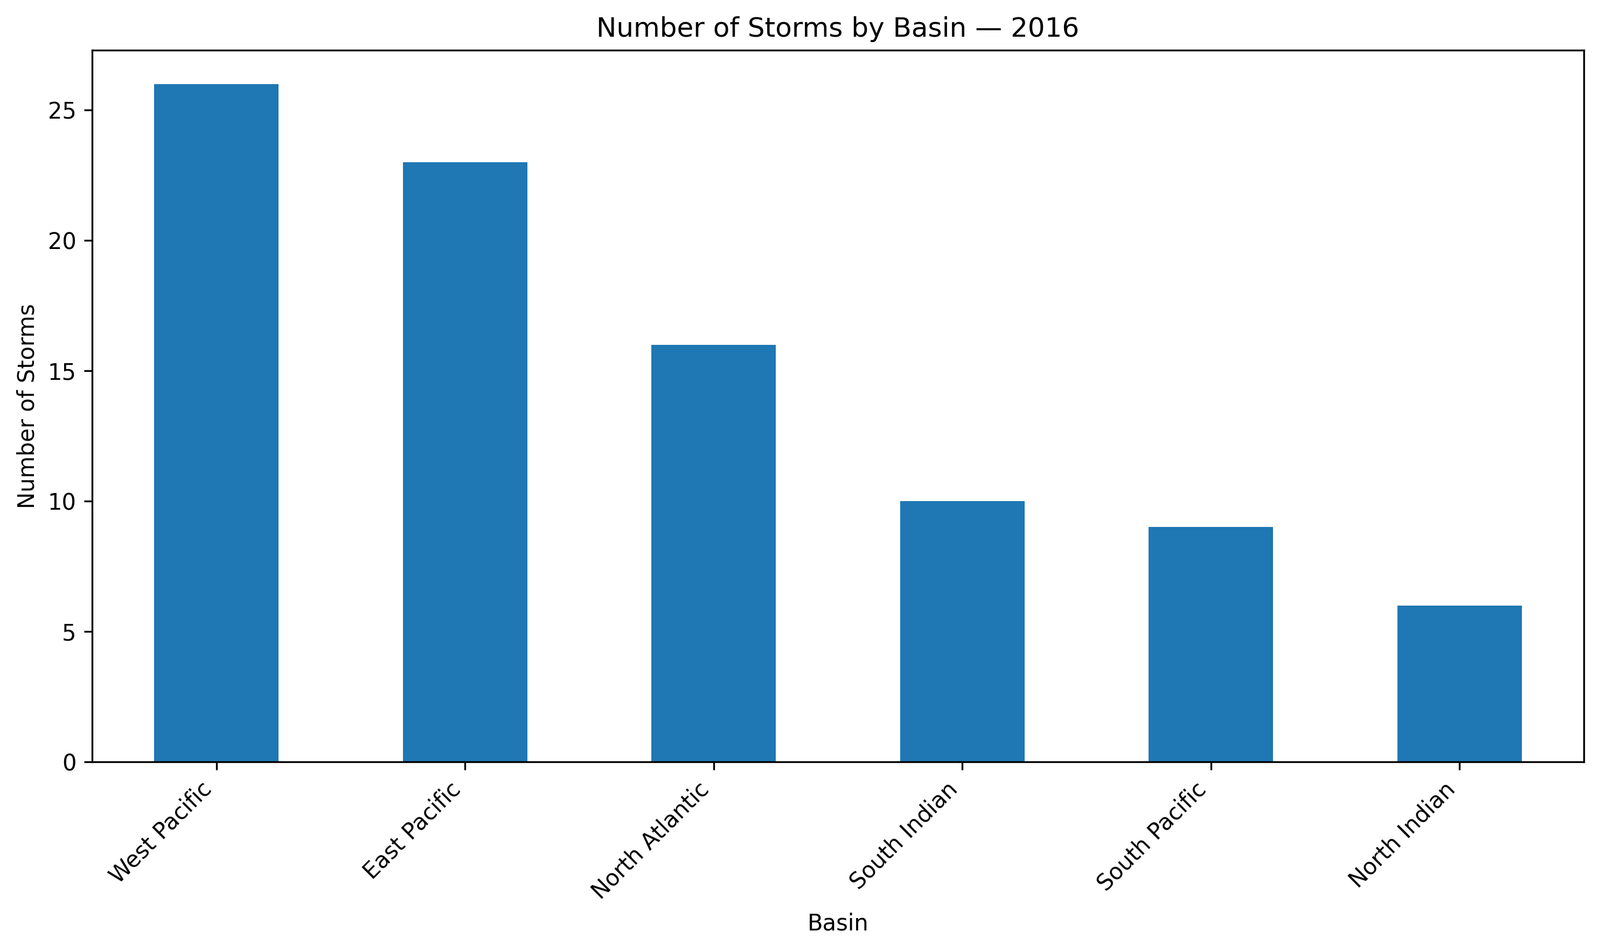
What this demonstrates
This is practical Python evidence: data ingestion, artifact checks, transformation, grouping, aggregation, joins, visualization, and report export—not simply coursework or syntax familiarity.